
Blog #3: The Joy of Math
20 July 2025
Overview
On July 8th 2025, Meaghan and I led a workshop we designed for the Yale Pathways to Science summer program. We guided 25 New Haven high school seniors through two interactive lessons on applied mathematics: one on the area of a circle and the origins of calculus, and another on approximating the speed of light with marshmallows.
Giving credit
While the lessons cover old ideas (one of them thousands of years old), Professor Stephen Strogatz's books The Joy of X and Infinite Powers are where I first read about them. Indeed, we titled our workshop "The Joy of Math" in his honor. You can find his author website here.
Lesson #1: Geometric proof for the area of a circle
Materials
- Whiteboard and markers (not necessary but recommended)
- Scissors (enough for all students, or pairs of students)
- Printed out circle templates (enough for all students, or pairs of students)
- Straight edges (enough for all students, or pairs of students)
- Drawing utensils (enough for all students, or pairs of students)
First, hand out scissors and pieces of paper with a circle outline printed upon them. I try to have something tangible (or at least interactive) when teaching, especially for pre-college students. Handing out props early helps build excitement, so we made no effort to hide the microwave and bag of marshmallows, either (more on that in Lesson #2).
Next, ask some increasingly challenging questions, allowing the students to discuss:
- What makes a circle a circle?
- What is the area of a shape?
- How do we find the area of a rectangle?
- What properties of a circle make its area more difficult to measure?
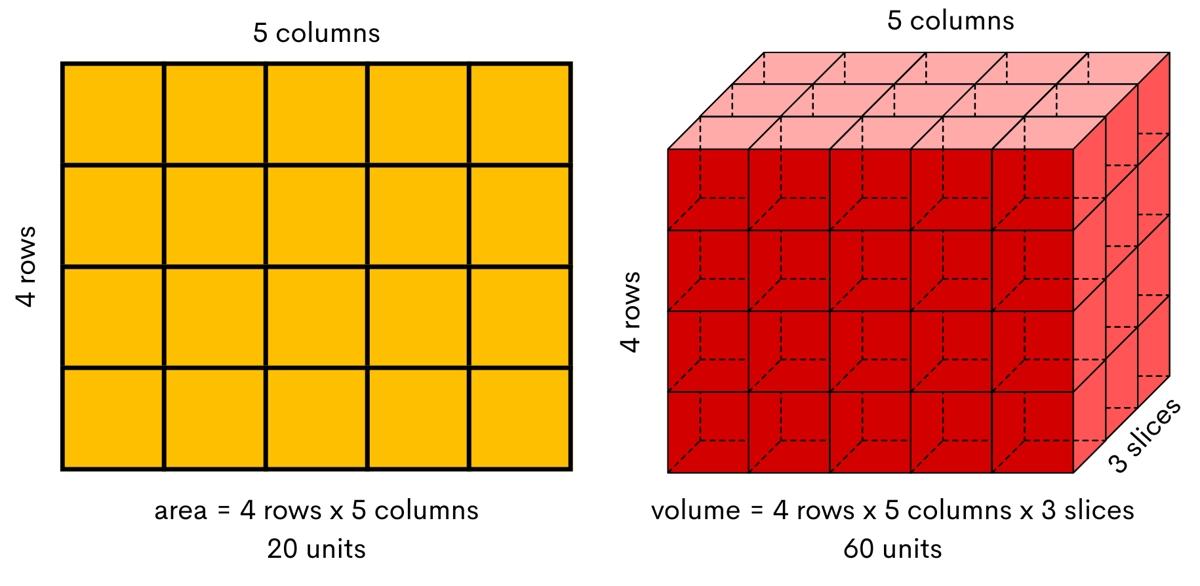
Visualization also provides an easy explanation of the commutative property of multiplication (a x b = b x a). 5 rows of 4 columns is the same as 4 rows of 5 columns, or length and width are a matter of perspective. These lines of reasoning will prime them for creative thinking and show math is something to understand, not memorize.
Now that our brains are limber, it's time to begin the exercise! Ask the students to cut out their paper circles. Then, have them divide their circles in half with a pencil and straight edge, shading in one half of the circle and leaving the other blank. Next, have the students cut their circles into two symmetric halves. Ask the class: does it make it any easier to measure the area? Give a bit of time for them to try a few ideas, then repeat halving.
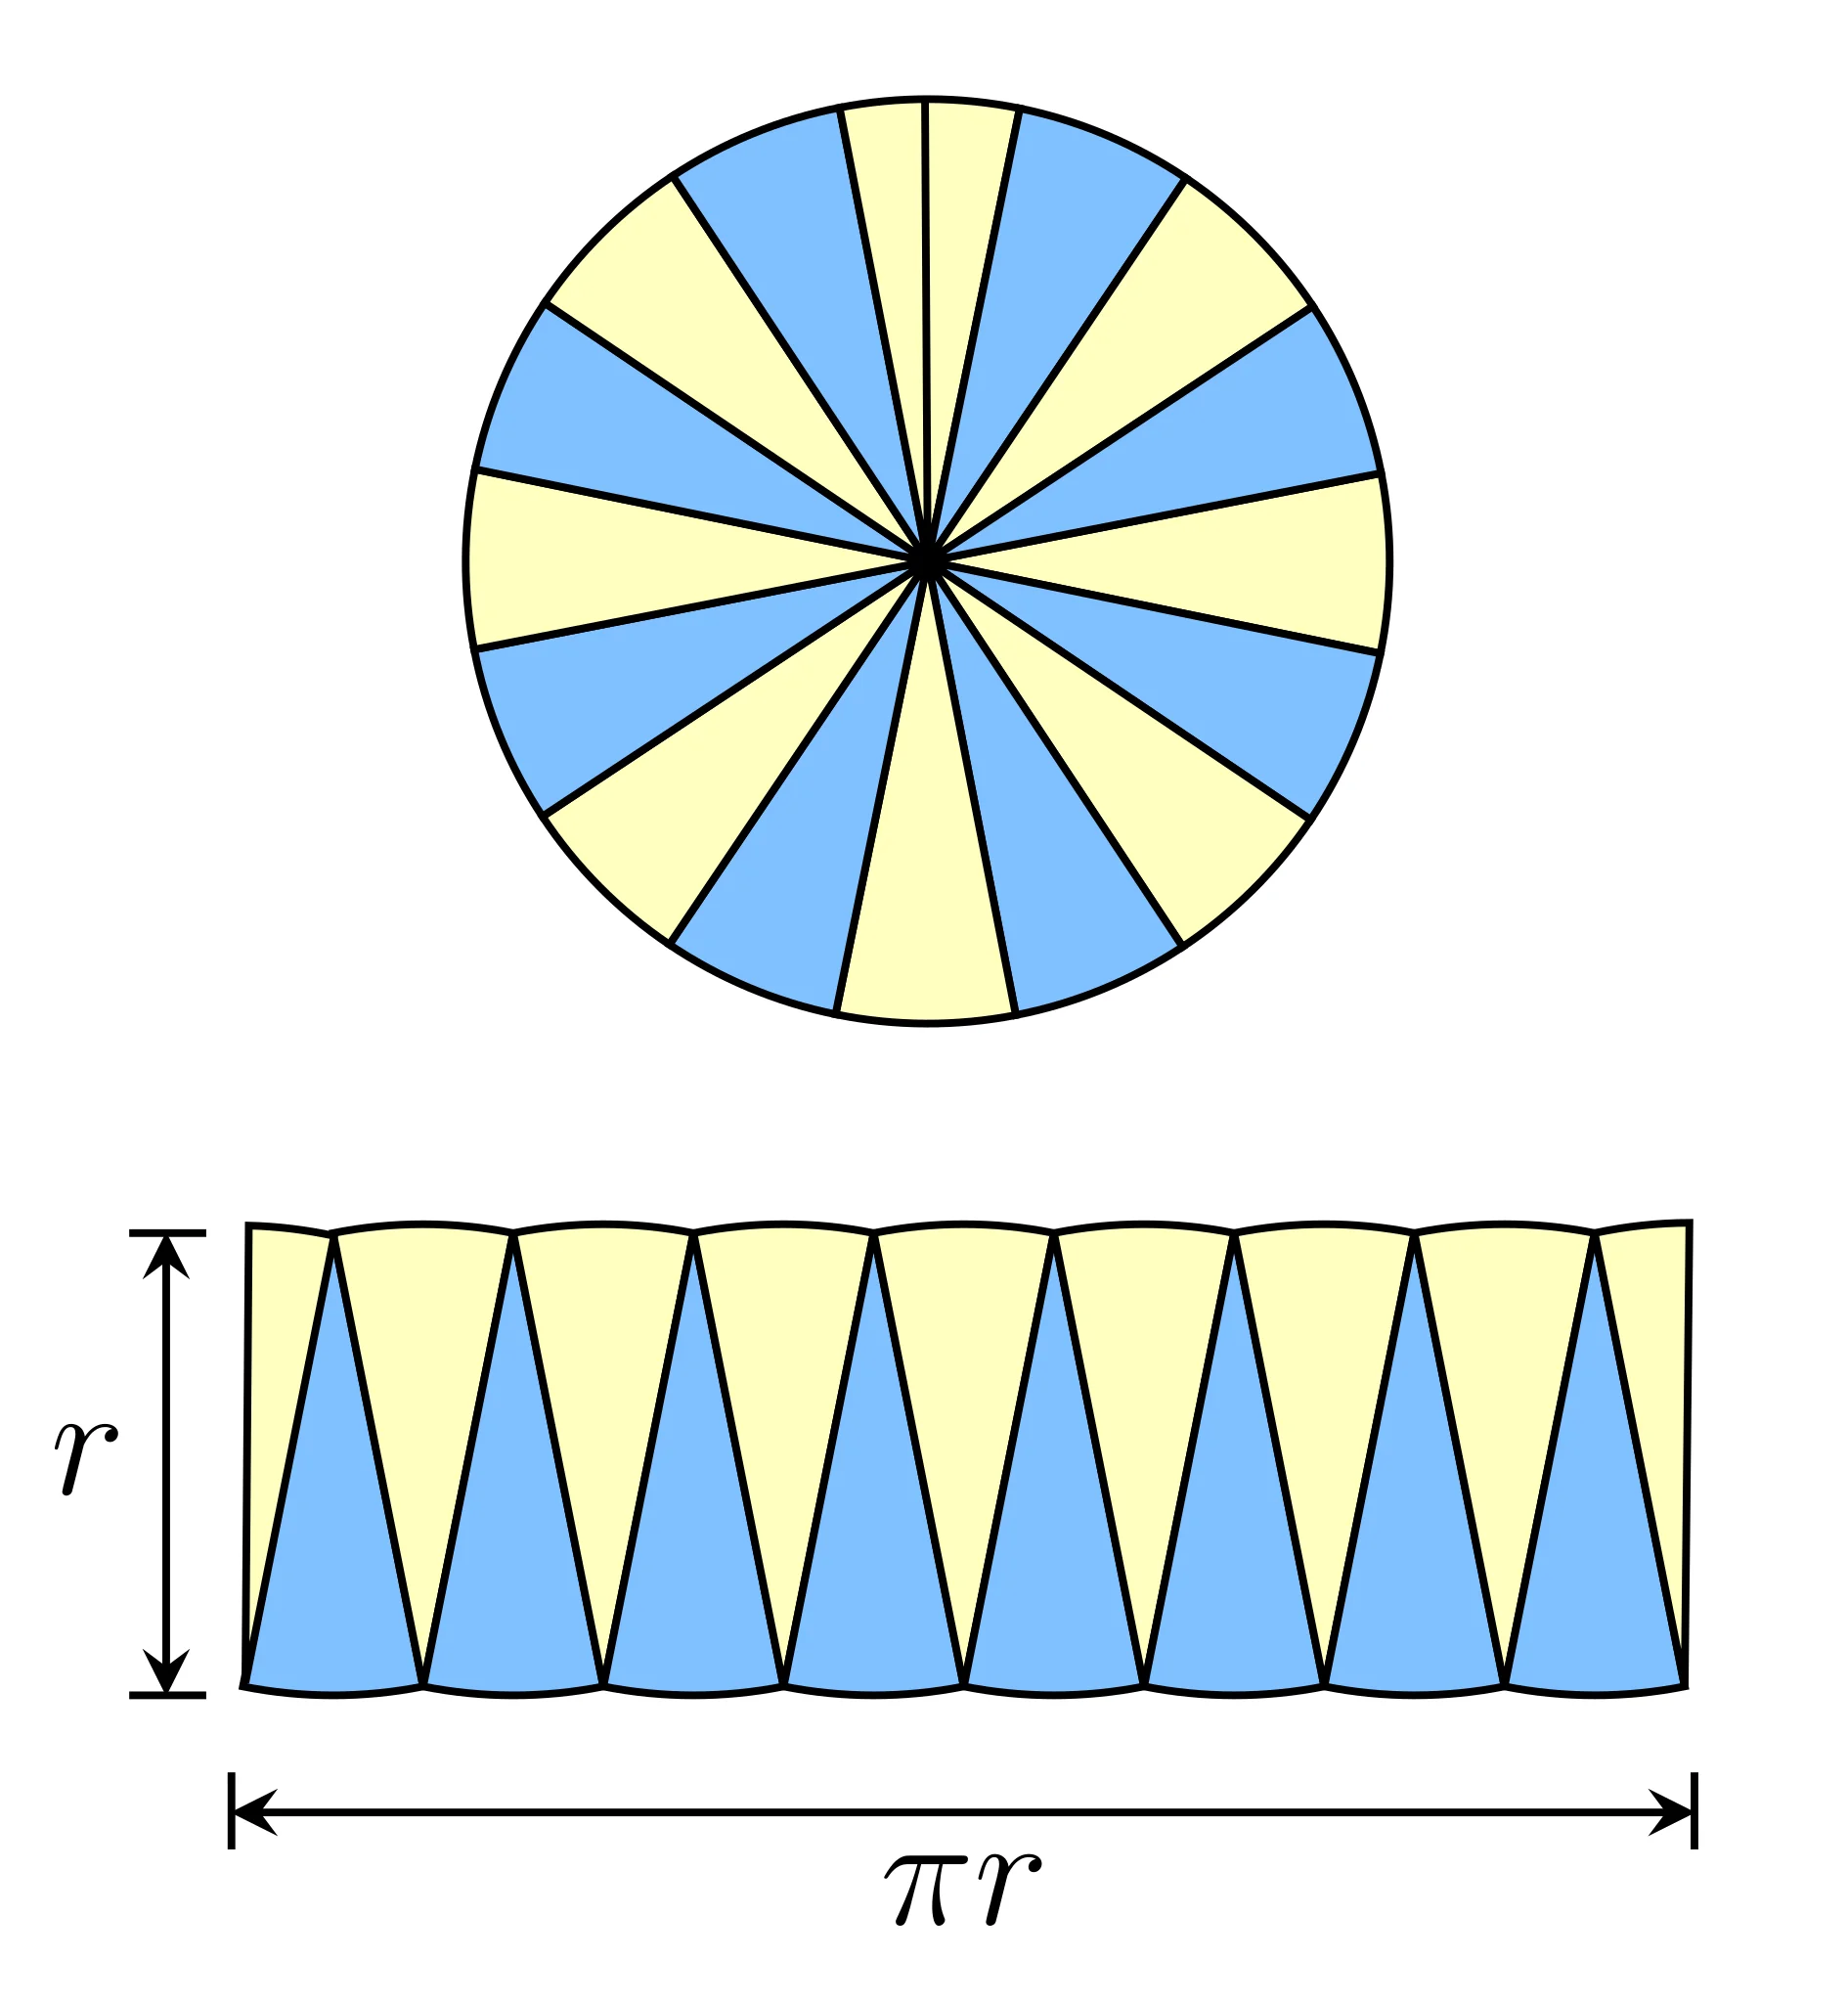
Once the students get to eighths, some may start to catch on. If not, start to guide them with drawings on the whiteboard. Ask them to alternate the wedges (the shading makes this easier!) like in the diagram below. It should become increasingly clear that what was once their circle is now a close approximation of a rectangle. Now for the final piece of the puzzle, ask: what is the length of this rectangle-like shape? What is the width?
As a final discussion, talk about how this method of finding the area for difficult shapes by breaking them into smaller and smaller pieces laid the foundation for calculus. Here, I tied in my research on cancer therapeutics, where we sometimes want to know the area under a curve generated in experiments, like testing which drugs are best at stopping cancer cell growth.
Lesson #2: Approximating the speed of light with marshmallows
Materials
- Whiteboard and markers (not necessary but recommended)
- One microwave with a known frequency (usually on a label on the edge of the door)
- One large bag of mini marshmallows
- One ruler with centimeter markings
- Paper plates (for melting marshmallows on)
While Lesson #1 can work for any age, Lesson #2 is more abstract and may be difficult for pre-high-school students. Similar to Lesson #1, we open with some general discussion, building up the complexity of our questions:
- What is light?
- What are some examples of light?
- Is all light visible?
- Does light always travel at the same speed?
- How does light travel?
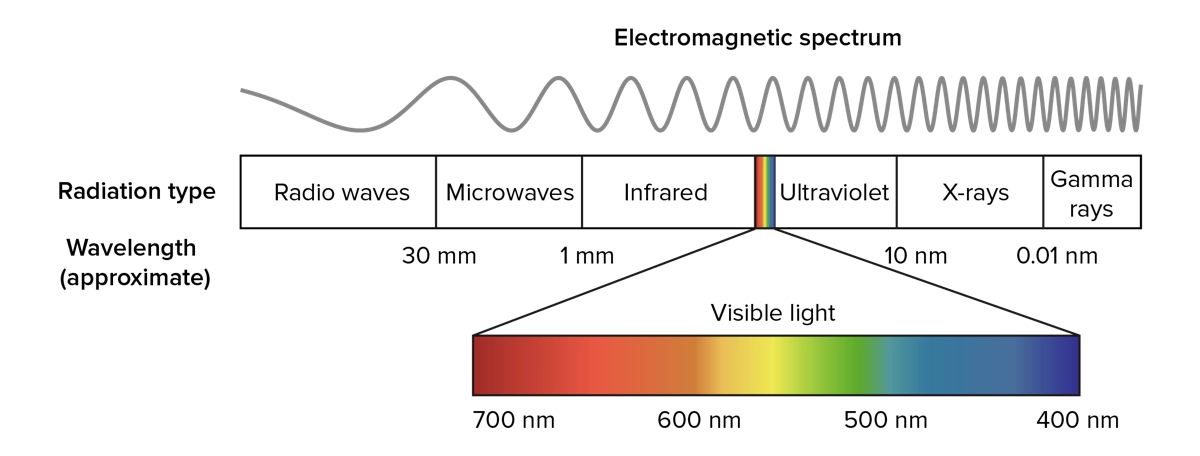
Next, we lay down some foundation. Describe the light spectrum, bringing in real-world examples familiar to the students like visible light, ultra-violet light, X-rays, radiowaves, and microwaves! I would recommend labeling the light spectrum on the board as you give examples, discussing how smaller wavelengths have more energy.
Now that the students understand that light is a wave, let's break down the properties of waves. It's important to note that the speed of light is constant (within a given medium), so we have:
where c is the speed of light in meters/second, λ is the wavelength in meters, and f is frequency in Hertz (second-1). I recommend f as opposed to v for frequency to avoid any confusion with velocity, which has the same unit as c. Since the speed of light is constant, frequency and wavelength must be inversely proportional!
This relationship may seem odd to the students at first, but we can use a runner's stride as an analogy: if two runners are moving at the same speed, and runner #1 has a longer stride (wavelength), runner #2 must have a quicker cadence (frequency).
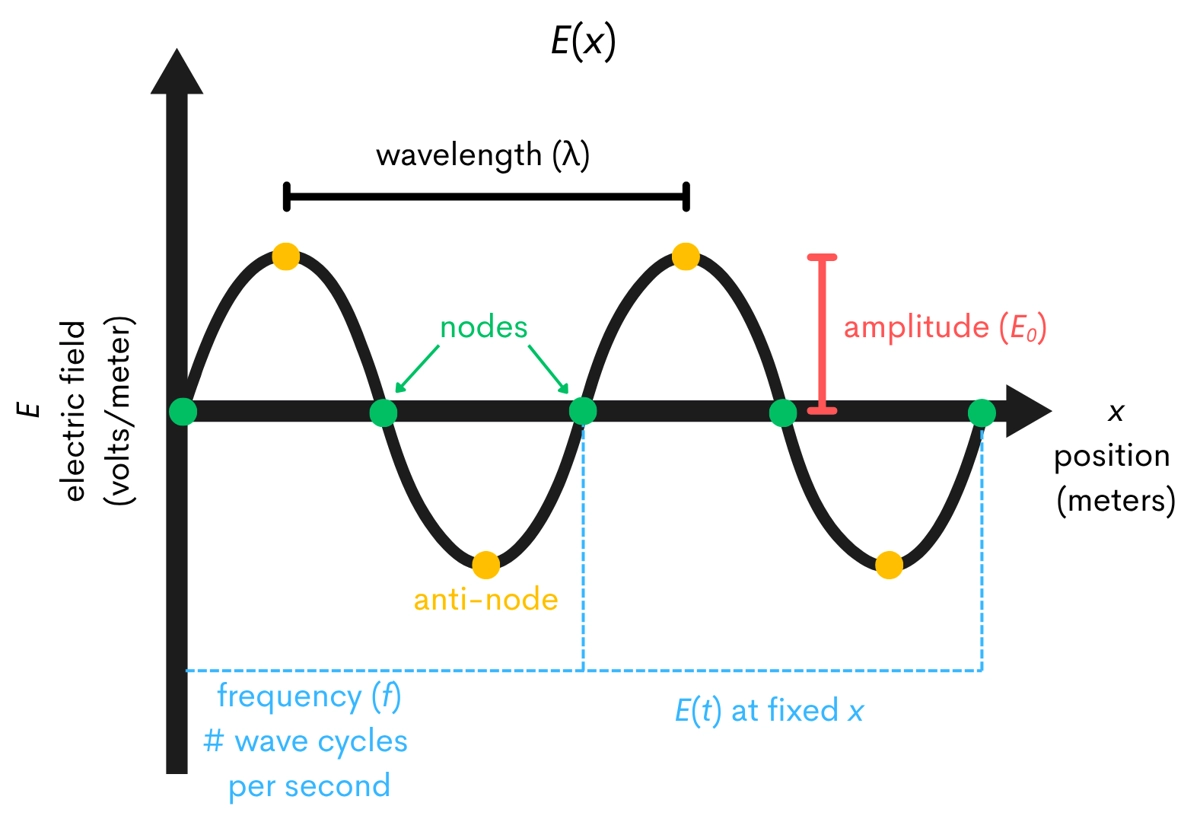
As a final piece of background, discuss how the energy transfer of a wave is proportional to the square of the electric field. Then ask the students, where would we expect a microwave to create the most heat? At the nodes, at the anti-nodes? Does the sign of the amplitude matter?
Time to bring it all home! Remove the turntable from the microwave and place a paper plate with a uniform layer of mini marshmallows. Microwave the plate for about 10 seconds, then quickly remove it. There will be alternating bands of melted and unmelted marshmallows, representing anti-nodes and nodes, respectively. Walk around and show the students!
Next, measure the distance between the center of the melted bands (anti-nodes) using a ruler in centimeters. We will need to convert to meters, which is also a nice lesson for the students. I measured 6 cm, or 0.06 meters. Remember, this is one-half of our wavelength, so double it to get the wavelength (0.12 meters).
The wavelength (λ) is 0.12 meters. The frequency(f) of the microwave is 2450 MHz, or 2,450,000,000 Hz. Thus, our equation is:
The measured speed of light is 299,792,458 m/s, so our experiment gives a result within about 2% of the true value. Not bad for marshmallows and a microwave!
James